- Messages
- 41
- Reaction score
- 0
- Points
- 26
Mga lodi na expert sa programming at petmalu yung experience sa coding... need ko po ng help ninyo.
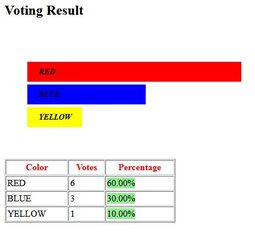
Newbie palang ako sa PHP, CSS and HTML. Need ko lang magkaroon ng output na may graph based sa value ng percentage sa data ko.
View attachment 342304
Kaya lang naka-set na kase yung value ng width nyan. Ang gusto ko sanang mangyari, ma-update yung width ng bar graph based sa value ng data ko.
<?php
$con = mysqli_connect('localhost','root','','color');
// Check connection
if (mysqli_connect_errno())
{
echo "Failed to Connect to MYSQL:" .mysqli_connect_errno();
}
mysqli_select_db($con,"color");
$sql="SELECT colorname, colorvalue, ROUND((colorvalue * 100 / (select sum(colorvalue) FROM colorcode)),2) AS colorvote
FROM colorcode";
$result=mysqli_query($con,$sql);
?>
<html>
<head>
<title>My Favorite Primary Color</title>
</head>
<style>
p {
color: red;
}
pb {
line-height: 10px;
background: lightgreen;
width:$perwid%;
}
.bargraph {
list-style: none;
padding-top: 20px;
width:560px;
}
ul.bargraph li {
height: 35px;
color: black;
text-align: left;
font-style: italic;
font-weight:bolder;
font-size: 14px;
line-height: 35px;
padding: 0px 20px;
margin-bottom: 5px;
}
ul.bargraph li.red {
background: red;
width:60%;
}
ul.bargraph li.blue {
background: blue;
width:30%;
}
ul.bargraph li.yellow {
background: yellow;
width:10%;
}
</style>
<body>
<h2>Voting Result</h2>
<table width="300" border="1" cellpadding="2" cellspacing="1">
<tr>
<th><p>Color</p></th>
<th><p>Votes</p></th>
<th><p>Percentage</p></th>
<tr>
<ul class="bargraph">
</ul>
<ul class="bargraph">
<li class="red">RED</li>
<li class="blue">BLUE</li>
<li class="yellow">YELLOW</li>
<li class="xaxis"></li>
</ul>
<?php
while ($row=mysqli_fetch_assoc($result)) {
$perwid = $row['colorvote'];
echo "<tr>";
echo "<td>".$row['colorname']."</td>";
echo "<td>".$row['colorvalue']."</td>";
echo "<td><pb>".$perwid."%</pb></td>";
// echo "<td>".$row['colorvote']."%</td>";
echo "</tr>";
}//end while
?>
</body>
</html>
Yan po yung current code ko. Sana po matulungan nyo ako, hindi ko alam kung pano maa-update yung width ng bar graph based sa value ng percentage (colorvote) ng data ko. Thanks po in advance.