Hi ajluceromanalansan! salamat sa reply, actually walang errors, nag ask lang ako kung may alam ka about zedgrapg and how to graph on it real time...kung wala, try ko nalang mag explore tapos balik ako dito if nagkaproblema along the way.. tnx ^_^
update...
=====
my code here:
using System;
using System.Collections.Generic;
using System.ComponentModel;
using System.Data;
using System.Drawing;
using System.Linq;
using System.Text;
using System.Threading.Tasks;
using System.Windows.Forms;
using System.IO.Ports;
using ZedGraph;
namespace WindowsFormsApplication4
{
public partial class Form1 : Form
{
string datafromcom;
double iDAT;
////double[] x = new double[100];
////double[] y = new double[100];
////int i;
////PointPairList listPointsOne = new PointPairList();
////LineItem myCurveOne;
// Starting time in milliseconds
int tickStart = 0;
public Form1()
{
InitializeComponent();
}
public void connectbutton_Click(object sender, EventArgs e)
{
serialPort1.PortName = comporttextbox.Text;
serialPort1.BaudRate = Convert.ToInt32(baudratetextbox.Text);
if (serialPort1.IsOpen) return;
serialPort1.Open();
//myport = new serialPort1
//myport.PortName = comporttextbox.Text;
//myport.BaudRate = Convert.ToInt32(baudratetextbox.Text);
//if (myport.IsOpen) return;
//myport.DtrEnable = true;
//myport.RtsEnable = true;
//myport.Open();
connectbutton.Enabled = false;
disconnectbutton.Enabled = true;
comporttextbox.Enabled = false;
baudratetextbox.Enabled = false;
}
//public void AddDataMethod(String myString)
//{
// richtextbox.AppendText(myString);
// richtextbox.ScrollToCaret(); //Para magscrolldown ng kusa.
//}
private void disconnectbutton_Click(object sender, EventArgs e)
{
if (serialPort1.IsOpen == false) return;
serialPort1.Close();
//if (myport.IsOpen == false) return;
//myport.Close();
connectbutton.Enabled = true;
disconnectbutton.Enabled = false;
comporttextbox.Enabled = true;
baudratetextbox.Enabled = true;
}
private void Form1_Load(object sender, EventArgs e)
{
GraphPane myPane = z1.GraphPane;
myPane.Title.Text = "Test of Dynamic Data Update with ZedGraph\n" +
"(After 25 seconds the graph scrolls)";
myPane.XAxis.Title.Text = "Time, Seconds";
myPane.YAxis.Title.Text = "Sample Potential, Volts";
// Save 1200 points. At 50 ms sample rate, this is one minute
// The RollingPointPairList is an efficient storage class that always
// keeps a rolling set of point data without needing to shift any data values
RollingPointPairList list = new RollingPointPairList(1200);
// Initially, a curve is added with no data points (list is empty)
// Color is blue, and there will be no symbols
LineItem curve = myPane.AddCurve("Voltage", list, Color.Blue, SymbolType.None);
// Sample at 50ms intervals
timer1.Interval = 50;
timer1.Enabled = true;
timer1.Start();
// Just manually control the X axis range so it scrolls continuously
// instead of discrete step-sized jumps
myPane.XAxis.Scale.Min = 0;
myPane.XAxis.Scale.Max = 30;
myPane.XAxis.Scale.MinorStep = 1;
myPane.XAxis.Scale.MajorStep = 5;
// Scale the axes
z1.GraphPane.AxisChange();
// Save the beginning time for reference
tickStart = Environment.TickCount;
////z1.IsShowPointValues = true;
////i = 0;
}
private void exitbutton_Click(object sender, EventArgs e)
{
Application.Exit();
}
private void serialPort1_DataReceived(object sender, SerialDataReceivedEventArgs e)
{
try
{
while (serialPort1.BytesToRead > 0)
{
datafromcom = serialPort1.ReadLine();
if (datafromcom.Trim() != "")
{
int iDAT = Convert.ToInt32(datafromcom);
////i++;
////i = (i + 1) % 100;
////x
= i;
////y = iDAT;
}
}
}
catch { }
}
private void timer1_Tick(object sender, EventArgs e)
{
richtextbox.Text = datafromcom;
// Make sure that the curvelist has at least one curve
if (z1.GraphPane.CurveList.Count <= 0)
return;
// Get the first CurveItem in the graph
LineItem curve = z1.GraphPane.CurveList[0] as LineItem;
if (curve == null)
return;
// Get the PointPairList
IPointListEdit list = curve.Points as IPointListEdit;
// If this is null, it means the reference at curve.Points does not
// support IPointListEdit, so we won't be able to modify it
if (list == null)
return;
// Time is measured in seconds
double time = (Environment.TickCount - tickStart) / 1000.0;
// 3 seconds per cycle
//curve.AddPoint(time, iDAT);
list.Add(time, iDAT);
// Keep the X scale at a rolling 30 second interval, with one
// major step between the max X value and the end of the axis
Scale xScale = z1.GraphPane.XAxis.Scale;
if (time > xScale.Max - xScale.MajorStep)
{
xScale.Max = time + xScale.MajorStep;
xScale.Min = xScale.Max - 30.0;
}
// Make sure the Y axis is rescaled to accommodate actual data
z1.AxisChange();
// Force a redraw
z1.Invalidate();
////z1.GraphPane.CurveList.Clear();
////z1.GraphPane.CurveList.Clear();
////z1.GraphPane.AddCurve(null, x, y, Color.Red, SymbolType.Circle);
////z1.GraphPane.AddCurve(null, listPointsOne, Color.Red);
////z1.AxisChange();
////z1.Invalidate();
}
}
}
==========================================
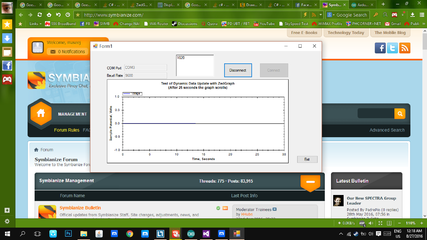
bale eto output niya, see pics. View attachment 284111
problema ko bro eh hindi ko malagay ng maayos ung data from serial to Zedgraph, okay naman ung timer as u can see pero ung y-axis since dun ilalagat ung data ko from serial mukhang may prob siya kaya flat lang.. paano kaya ang atake nito?") for free just give me a clear problem to solve
for free just give me a clear problem to solve 


") hope you'd undestand
hope you'd undestand